Figures
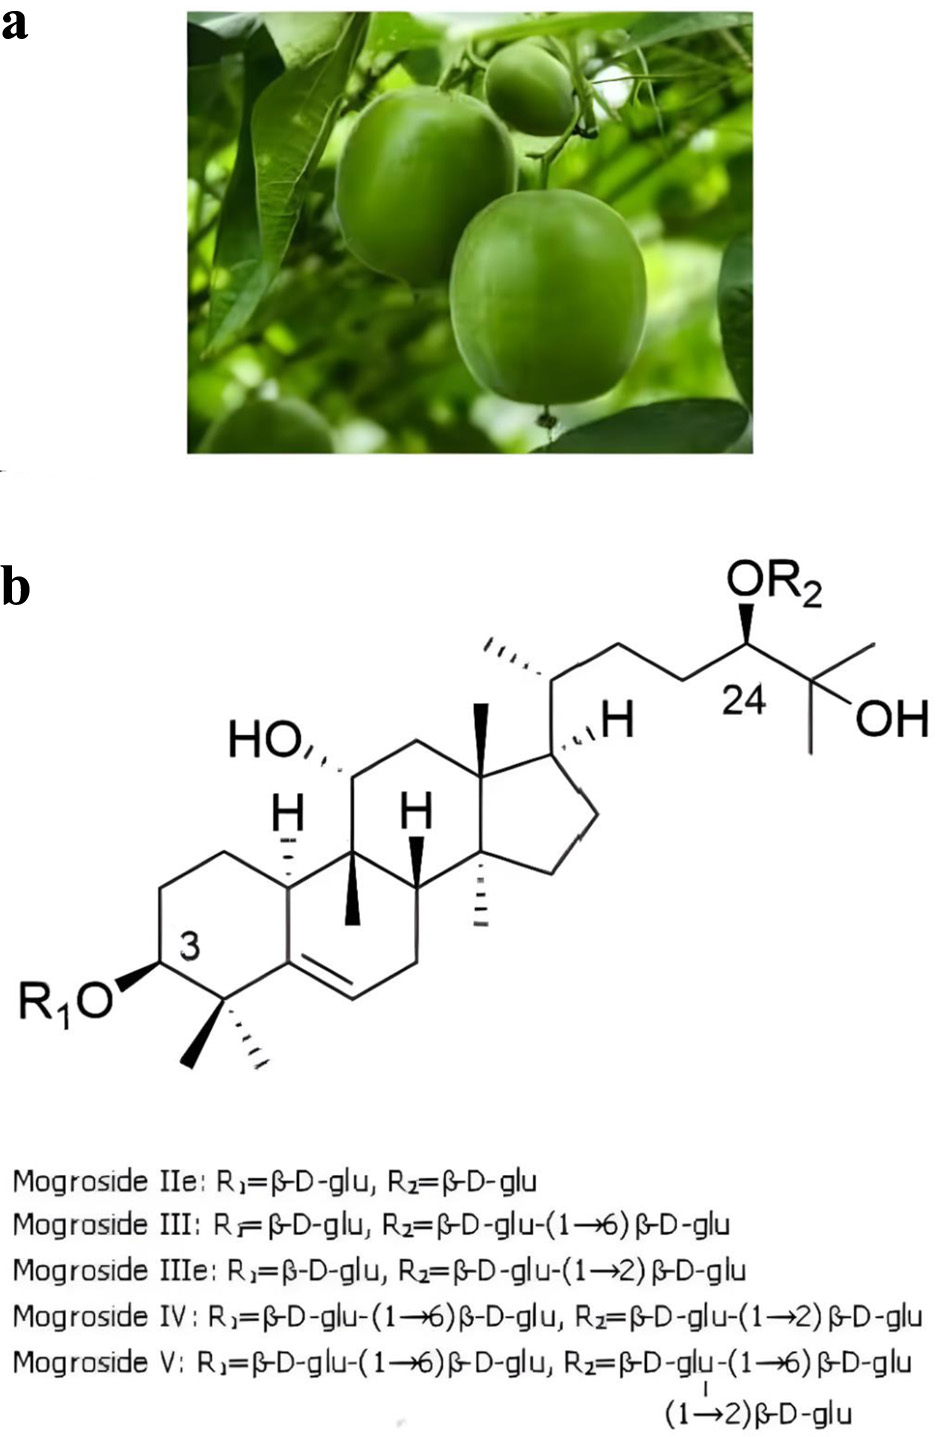
↓ Figure 1. (a) Monk fruit grown on tree. (b) Mogroside derivatives.
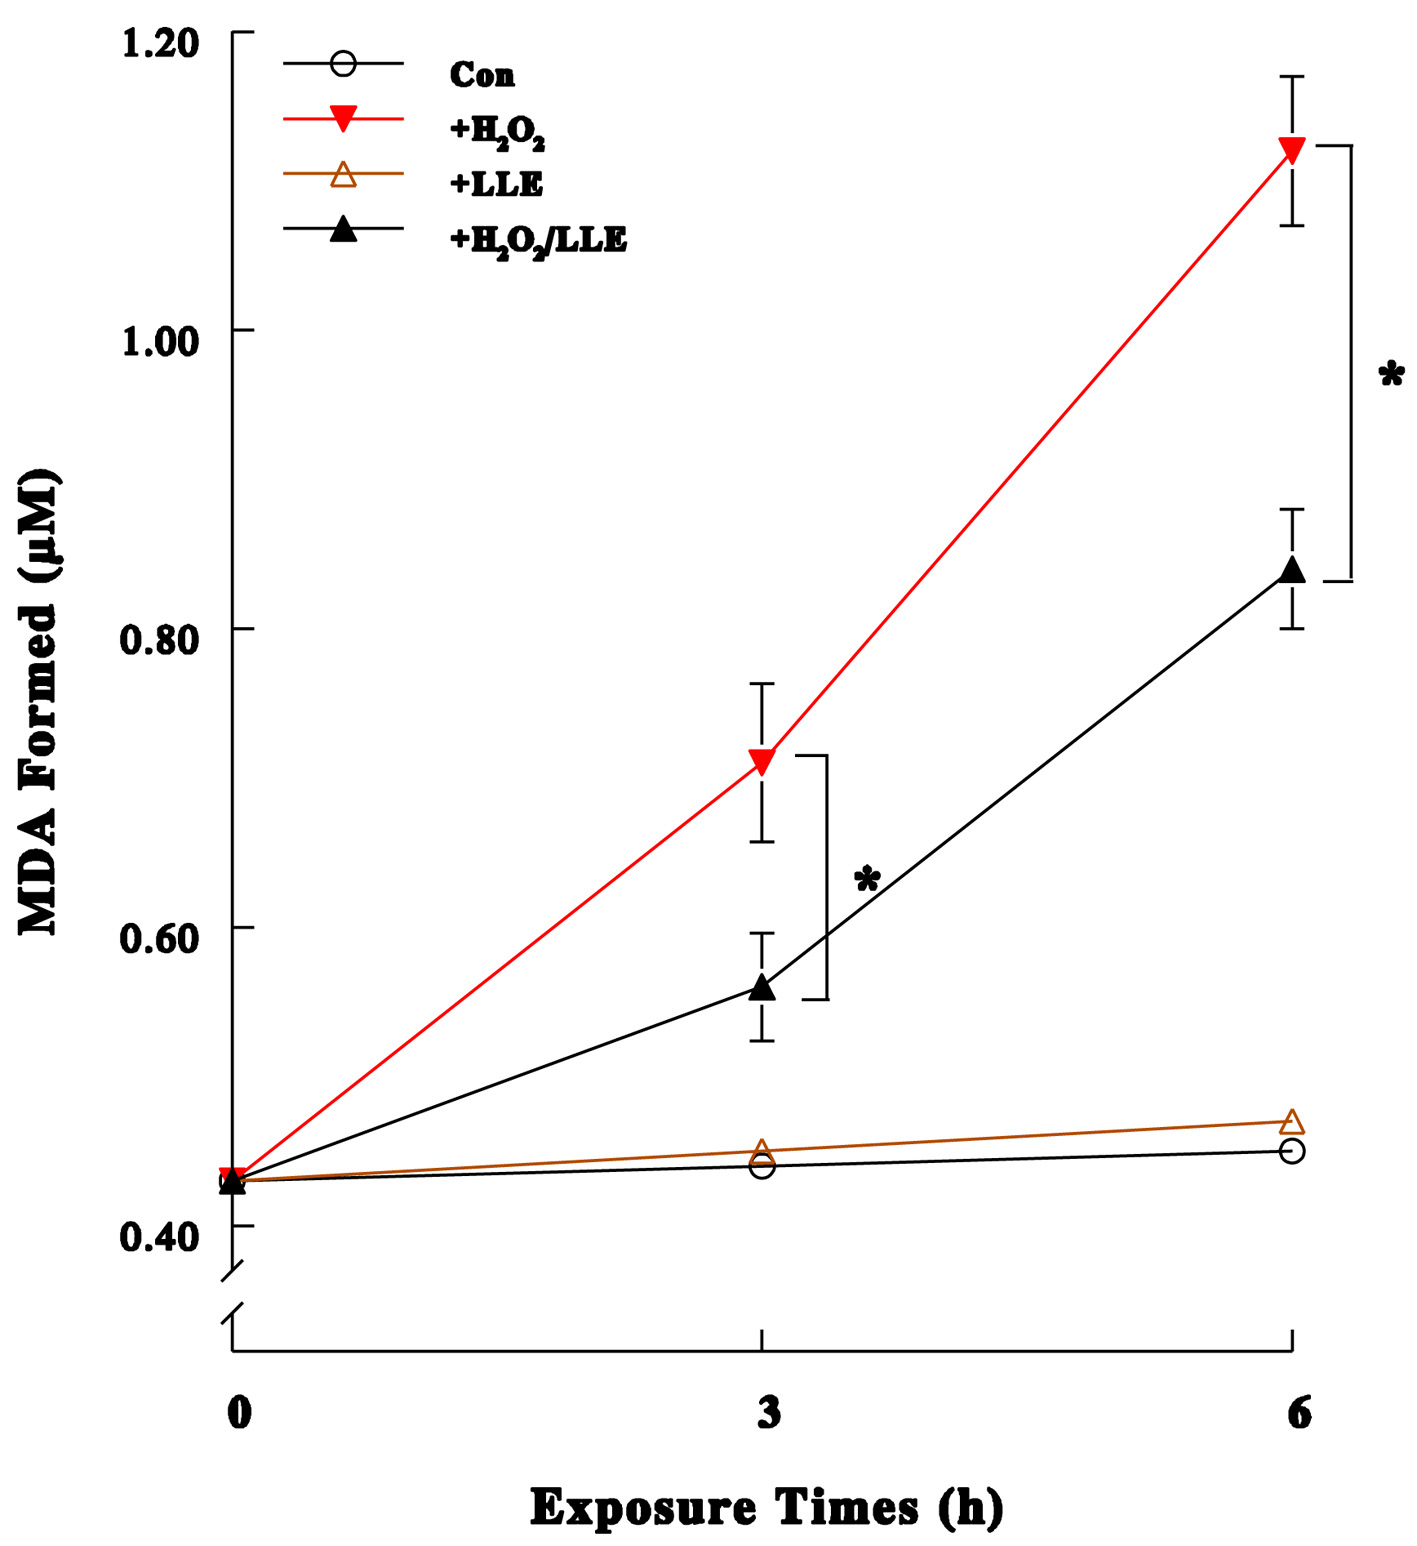
↓ Figure 2. Antioxidant effect of LLE (in vitro). After LLC-PK1 cells were exposed to H2O2 (70 μM) in the presence or absence of LLE (3 μg/mL) for 3 or 6 h, they were subjected to lipid peroxidation (LPO) assay. The amount of malondialdehyde (MDA) formed indicates severity of oxidative stress (OXS) (the greater MDA, the greater OXS). All data are mean ± standard deviation (SD) from three independent experiments (*P < 0.05, H2O2 vs. H2O2/LLE).
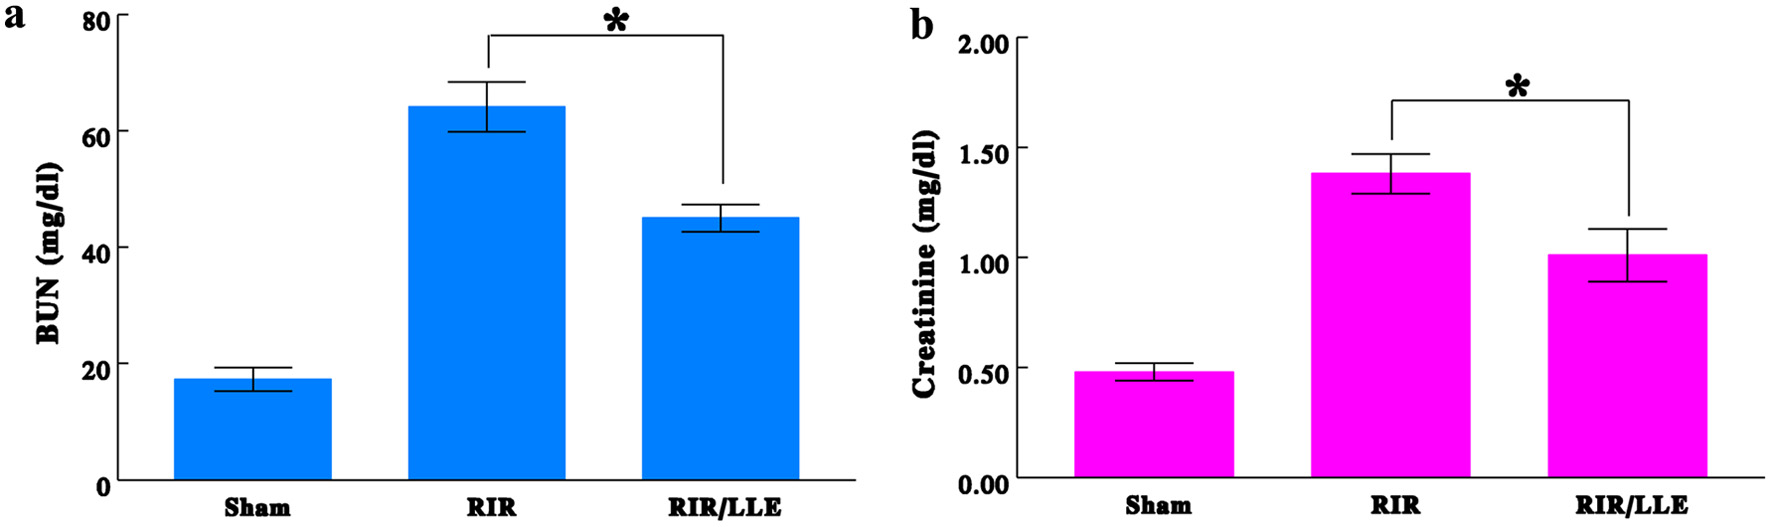
↓ Figure 3. Effects of renal ischemia-reperfusion (RIR) and RIR/LLE on blood urea nitrogen (BUN) and creatinine. Blood specimens collected from the rats were analyzed for the BUN (a) and creatinine (b) levels. The data are mean ± standard deviation (SD) from three samples of each group (*P < 0.05, RIR vs. RIR/LLE).
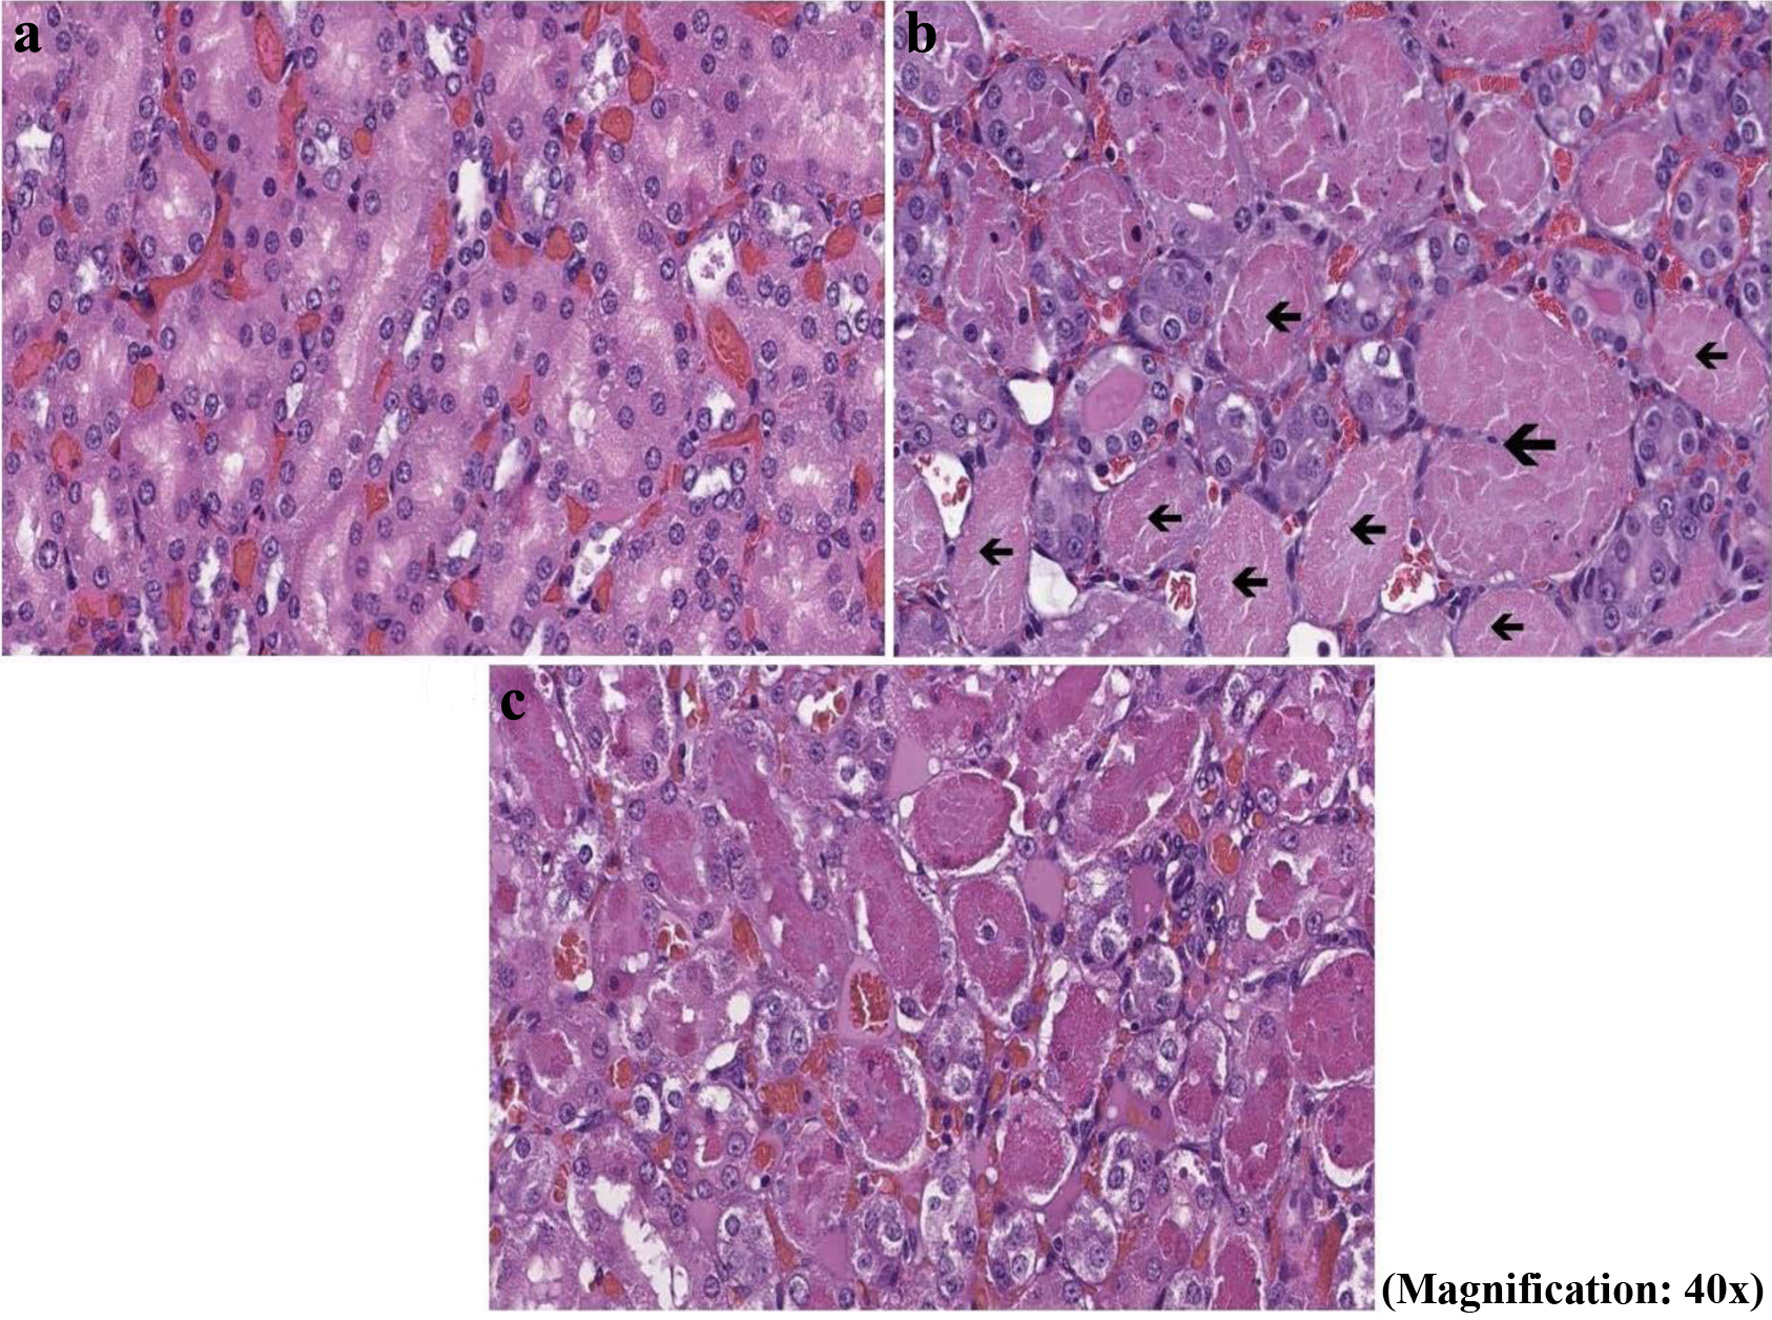
↓ Figure 4. Histopathologic examination of kidney tissues. The corticomedullary junction (CMJ) regions of kidney tissues obtained from three different experimental conditions—Sham (a), renal ischemia-reperfusion (RIR) (b), and RIR + LLE (c)—were histopathologically examined and photographed. Hematoxylin & eosin (H&E) staining showed enlarged and flattened tubular cells indicated by black arrows.
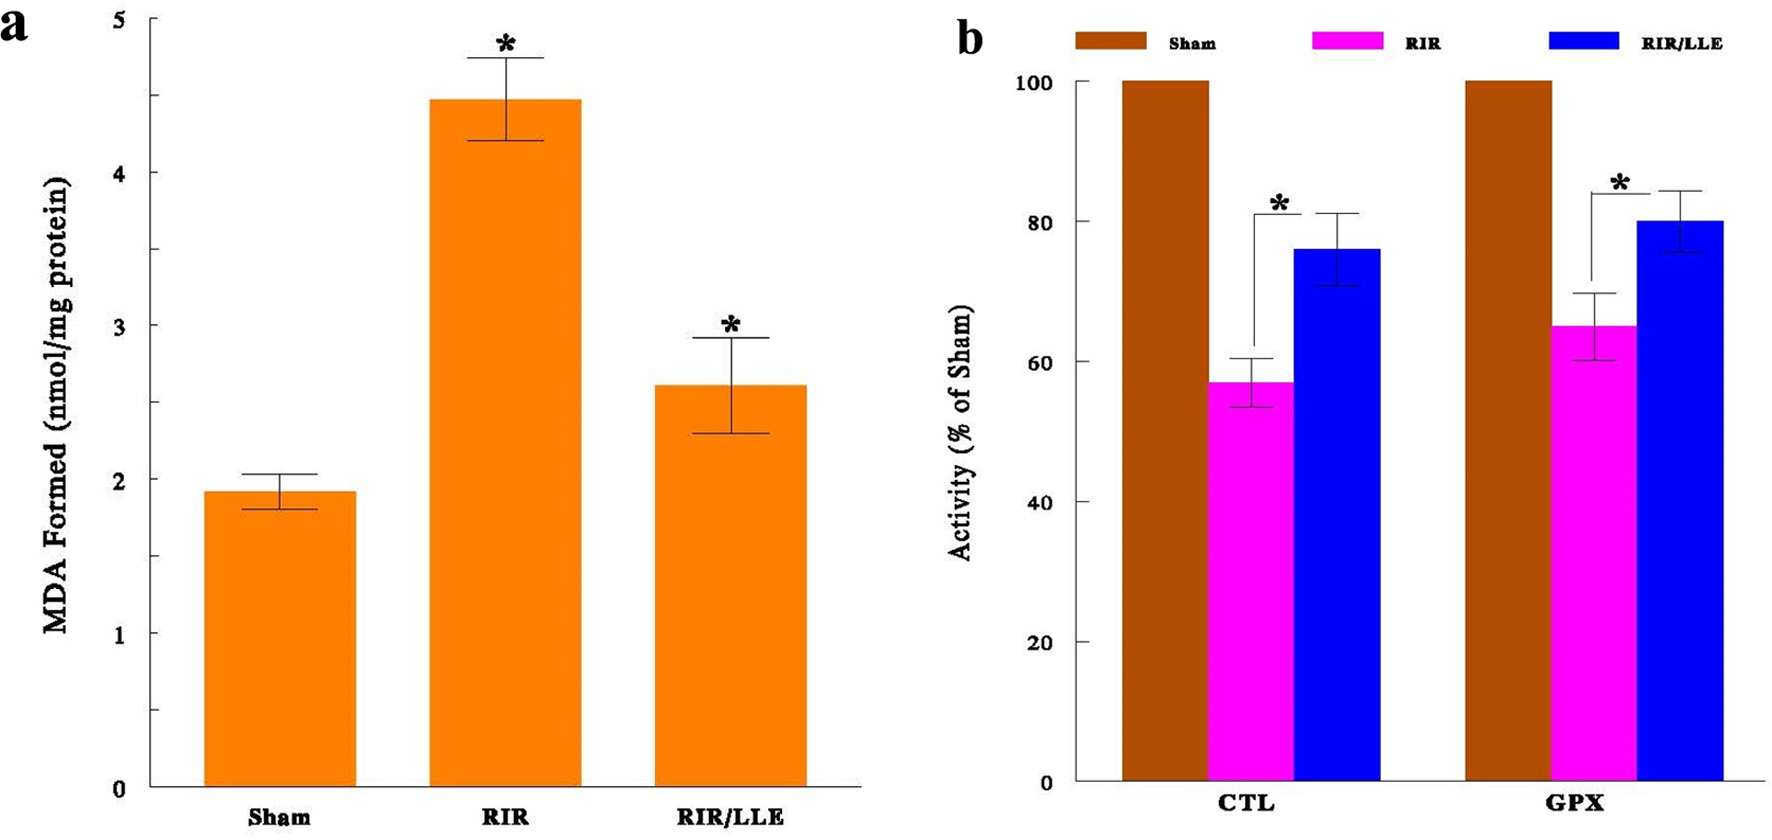
↓ Figure 5. (a) Oxidative stress (OXS) on kidneys during renal ischemia-reperfusion (RIR). OXS in different experimental conditions was assessed in kidney tissues by lipid peroxidation (LPO) assay. All data are mean ± standard deviation (SD) from three individual specimens of each experimental group (*P < 0.05 compared with Shams). (b) Inactivation of antioxidant enzymes during RIR. Three different experimental conditions of kidney tissues were assayed for activities of two antioxidant enzymes, catalase (CTL) and glutathione peroxidase (GPX). The data are mean ± standard deviation (SD) from three specimens of each group (*P < 0.05, RIR vs. RIR/LLE).
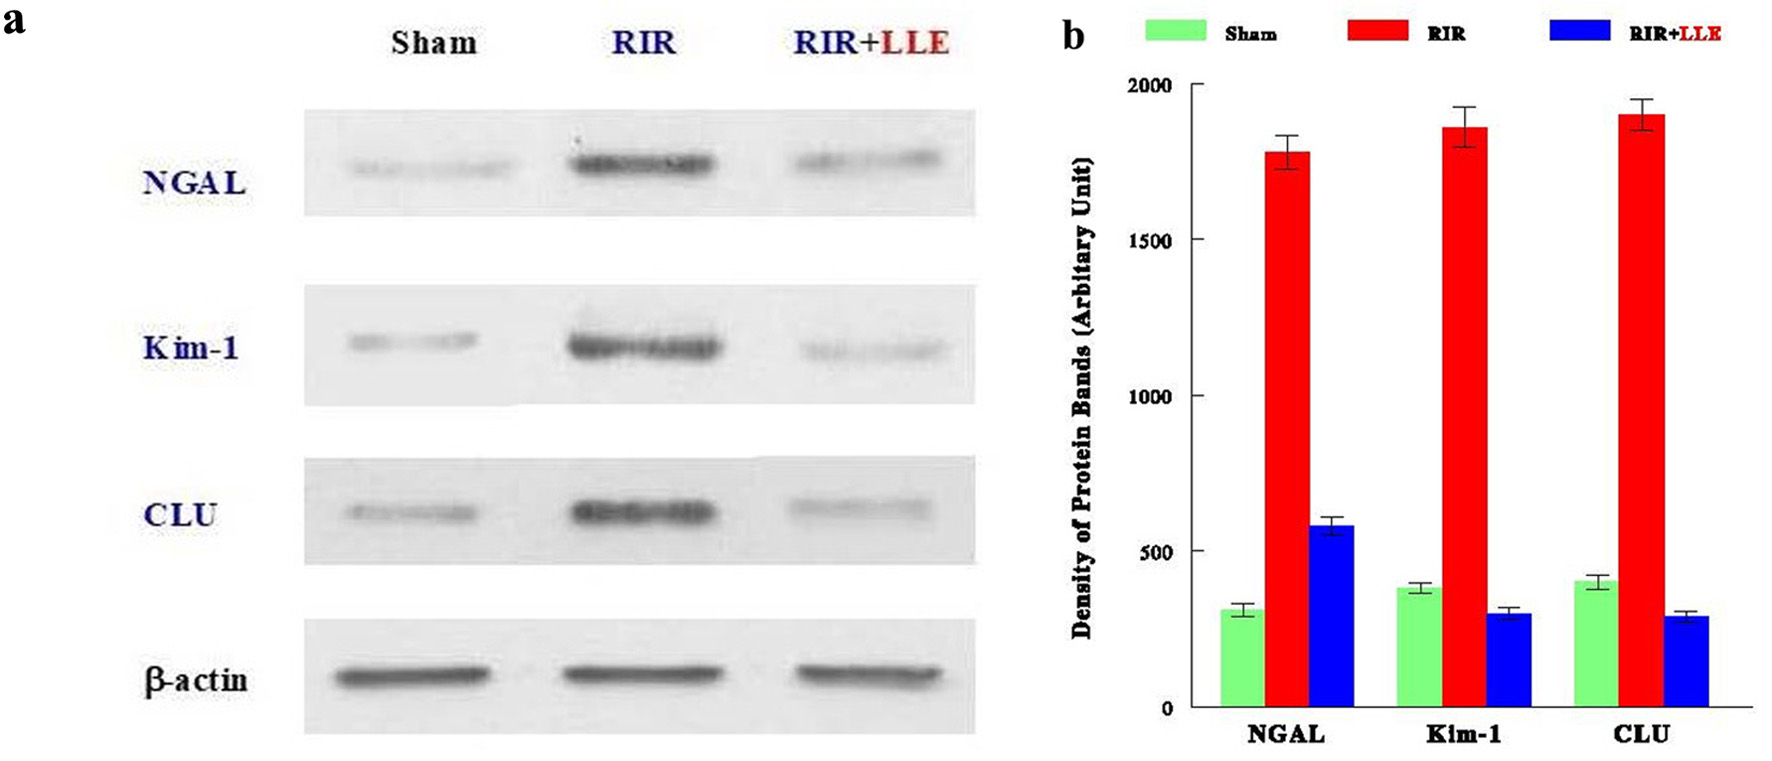
↓ Figure 6. Up-regulation of renal ischemia-reperfusion injury (RIRI) biomarkers under renal ischemia-reperfusion (RIR). Kidney tissues from three experimental conditions were analyzed for three RIRI biomarkers (NGAL, Kim-1 and CLU) using Western blots. (a) Autoradiographs of these markers are shown and β-actin was also run as a protein loading control. (b) The density of the protein bands was also quantified by scan densitometry and plotted in the graph.